| Consolidated Financial Highlight (As of 31 March) | Unit : Baht Million | ||
|---|---|---|---|
| 2020/21 | 2019/20 | 2018/19 | |
| Income Statement | |||
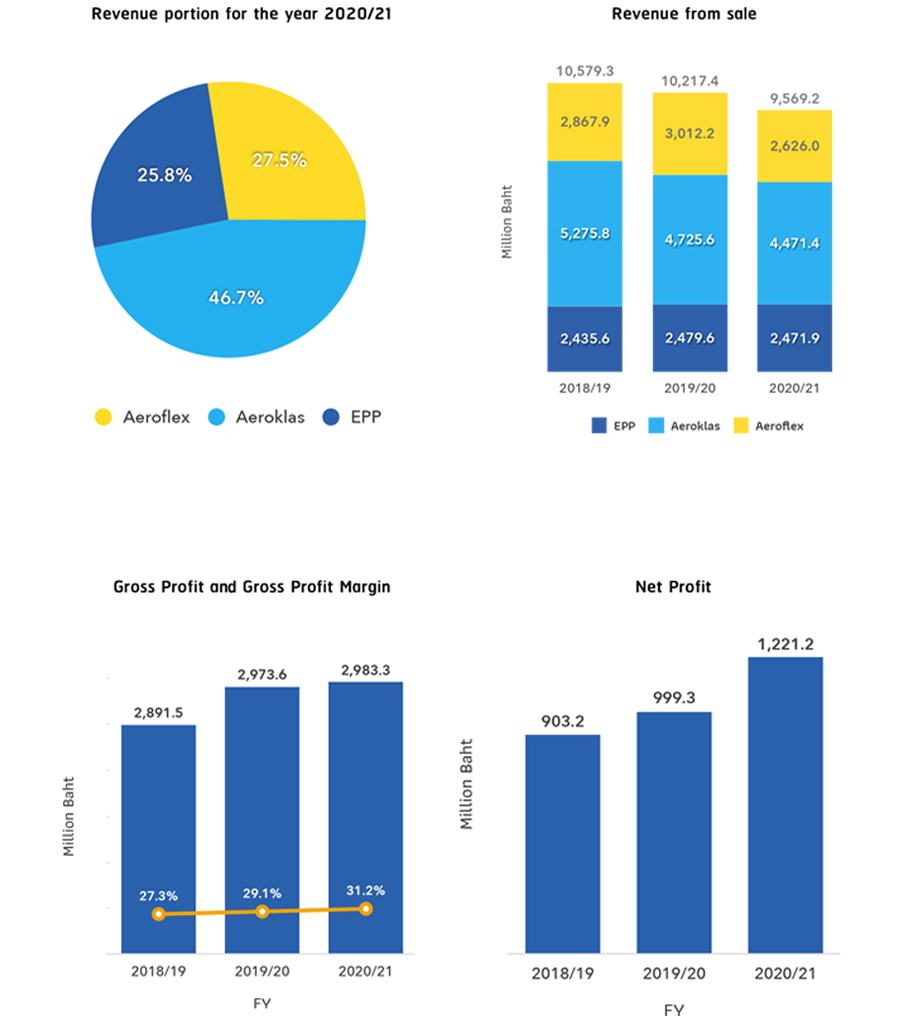
| Revenue from sale of goods | 9,569.2 | 10,217.4 | 10,579.2 |
| Aeroflex | 2,626.0 | 3,012.2 | 2,867.9 |
| Aeroklas | 4,471.4 | 4,725.6 | 5,275.8 |
| Eastern Polypack | 2,471.9 | 2,479.6 | 2,435.6 |
| Cost of goods sold | 6,586.0 | 7,243.8 | 7,687.8 |
| Gross Profit from sale | 2,983.3 | 2,973.6 | 2,891.5 |
| SG&A | 1,927.1 | 2,050.5 | 2,104.9 |
| Finance Cost | 61.3 | 30.1 | 40.0 |
| Share of profit from investments in associates | 92.6 | 126.8 | 174.8 |
| Income Tax | 35.4 | 68.3 | 51.6 |
| Net Profit | 1,221.2 | 999.3 | 903.2 |
| Financial Status | |||
| Total Asset | 15,404.8 | 14,032.2 | 13,393.2 |
| Total Liabilities | 4,364.3 | 3,458.0 | 3,077.9 |
| Paid Up Capital | 2,800.0 | 2,800.0 | 2,800.0 |
| Total Equity | 11,040.4 | 10,574.2 | 10,315.3 |
| Ratios | |||
| Net Profit Margin | 12.8% | 9.8% | 8.5% |
| ROE | 11.3% | 9.6% | 8.8% |
| ROA | 9.0% | 8.0% | 7.5% |
| D/E | 0.40 | 0.33 | 0.30 |
| Stock Data | |||
| Number of share (Million) | 2,800.0 | 2,800.0 | 2,800.0 |
| Par value (Baht) | 1.0 | 1.0 | 1.0 |
| Book value per share (Baht) | 3.94 | 3.78 | 3.68 |
| Earnings per share (Baht) | 0.44 | 0.36 | 0.32 |
* Excluding other revenue / other expenses / gain (loss) from exchange
